Reference
Views
Reference
Views
We use views as a broad term in Capacities whenever content (one or many objects) is displayed in a certain way. We distinguish between object views, data views, and the graph view.
- Object views are what your individual notes look like when linked to elsewhere
- Data views are what your object types look like
- Graph view is the visual representation of the links between your content.
Object views
Object views are the views for a single object. Here are the different object view categories using the example of a location object, London.
Links can sit in two places:
- Inline — inside a sentence (underlined text with an icon)
- Block — on their own line or paragraph (small card, link block, embed, and so on)
Only block links use the views below (except the inline view itself). Default link views apply to block links only.
Inline Links
If you prefer inline views and use them more than other views, you can go to Settings > Editor > Always create inline links to create this default behaviour.
Not seeing the icon next to your in-line links? Try linking as you're typing rather than highlighting text and linking from there.
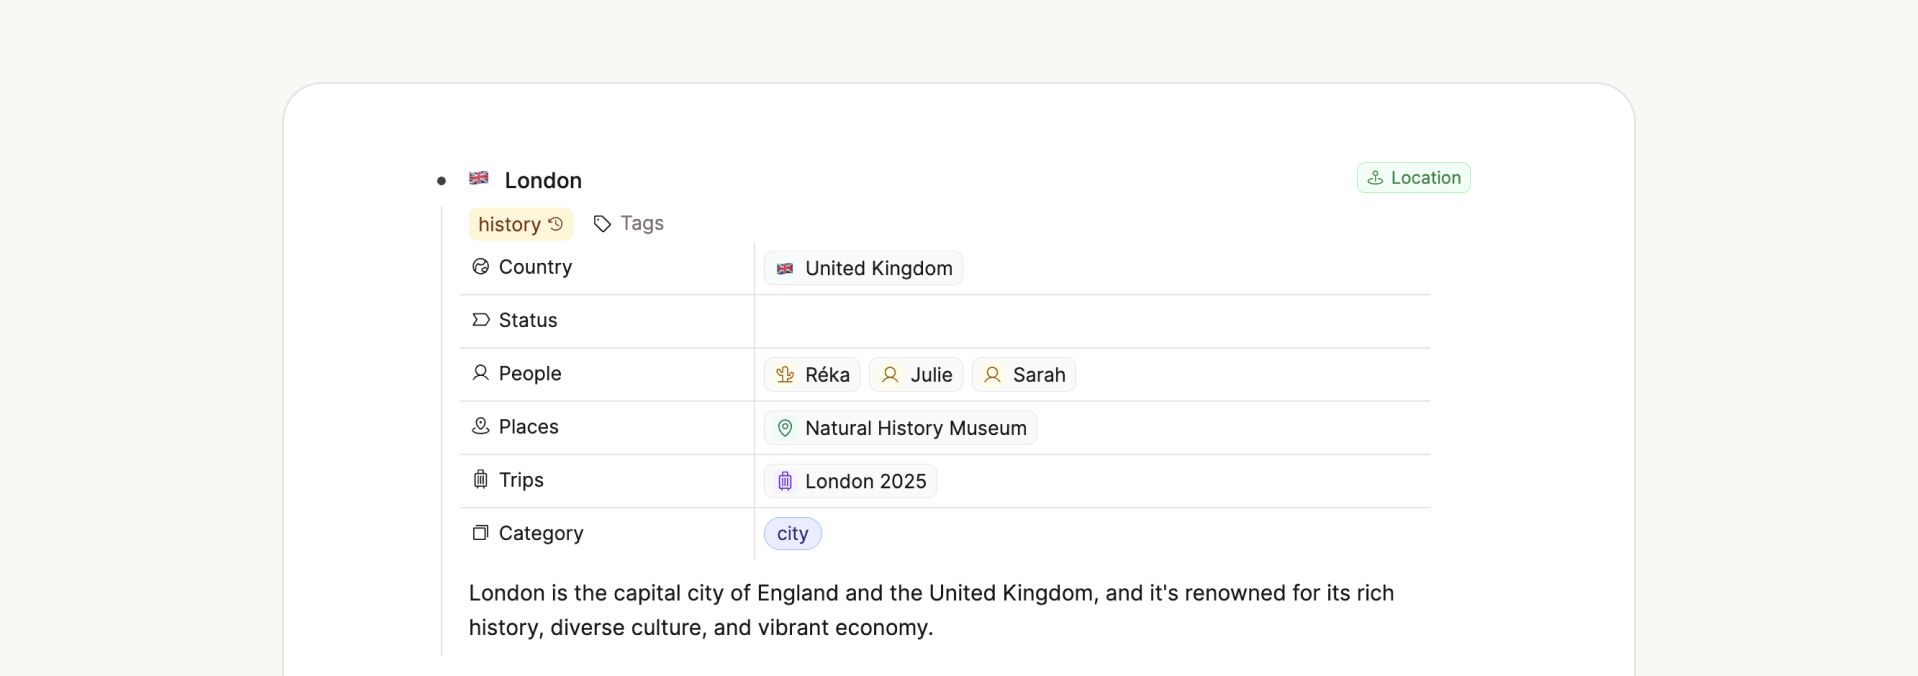
Link Block view
Small card view
You can customize what appears on this small card view.
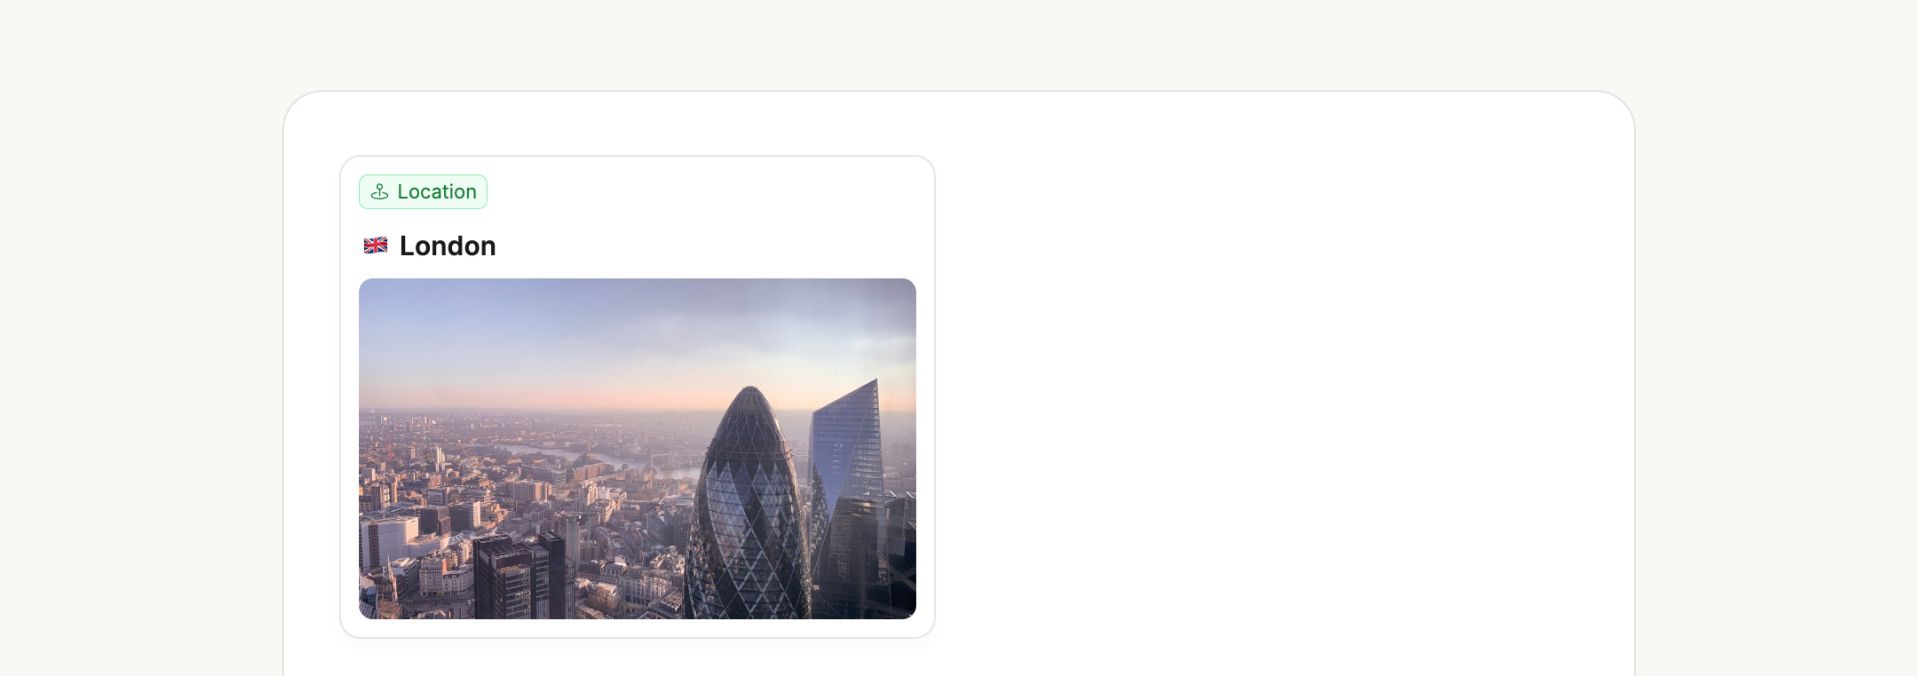
Wide card view
Embed view
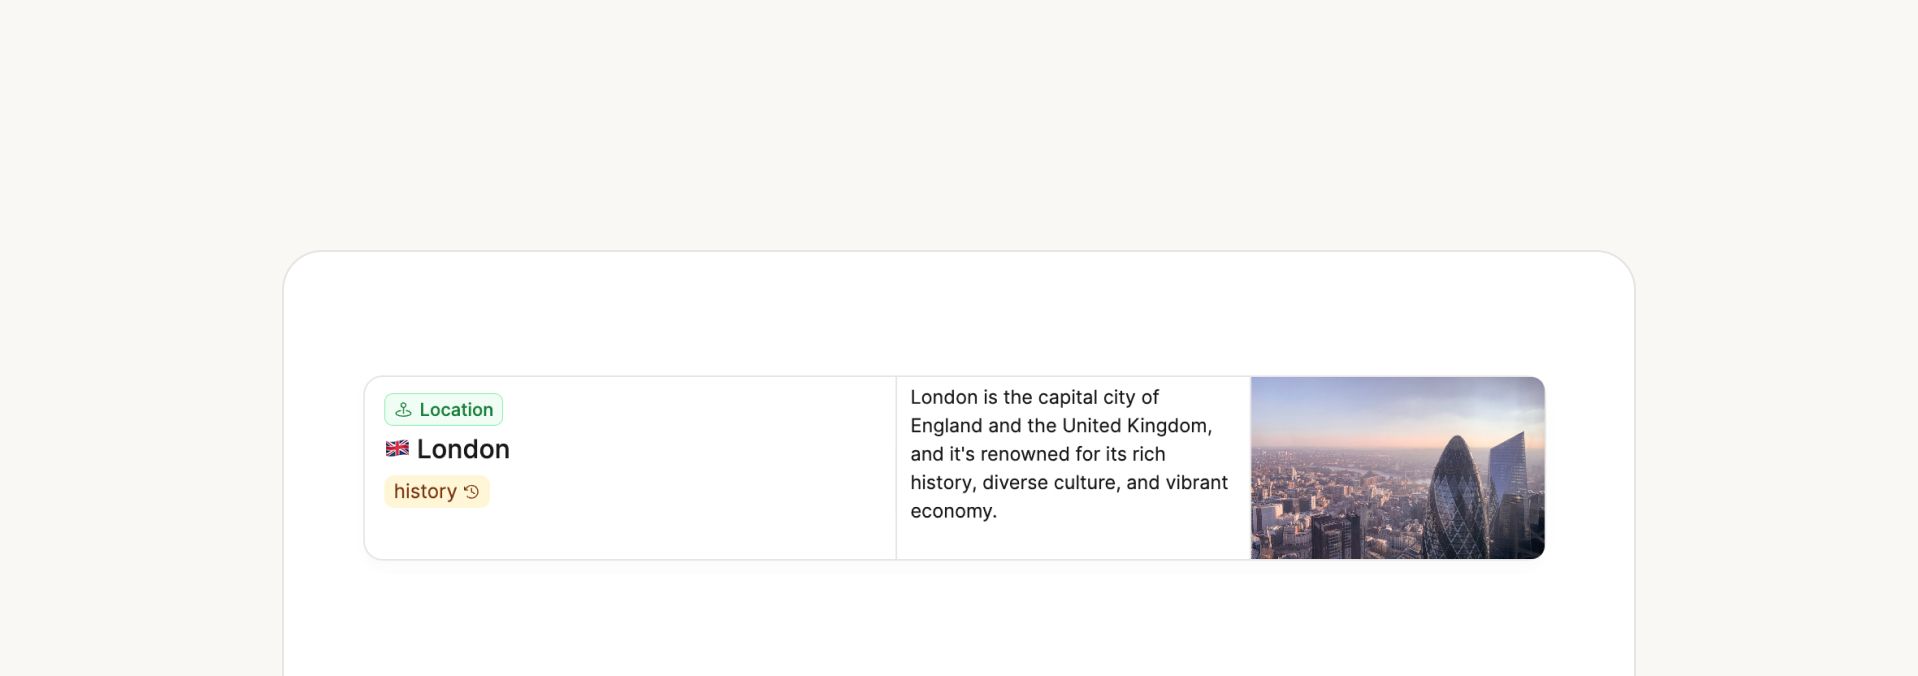
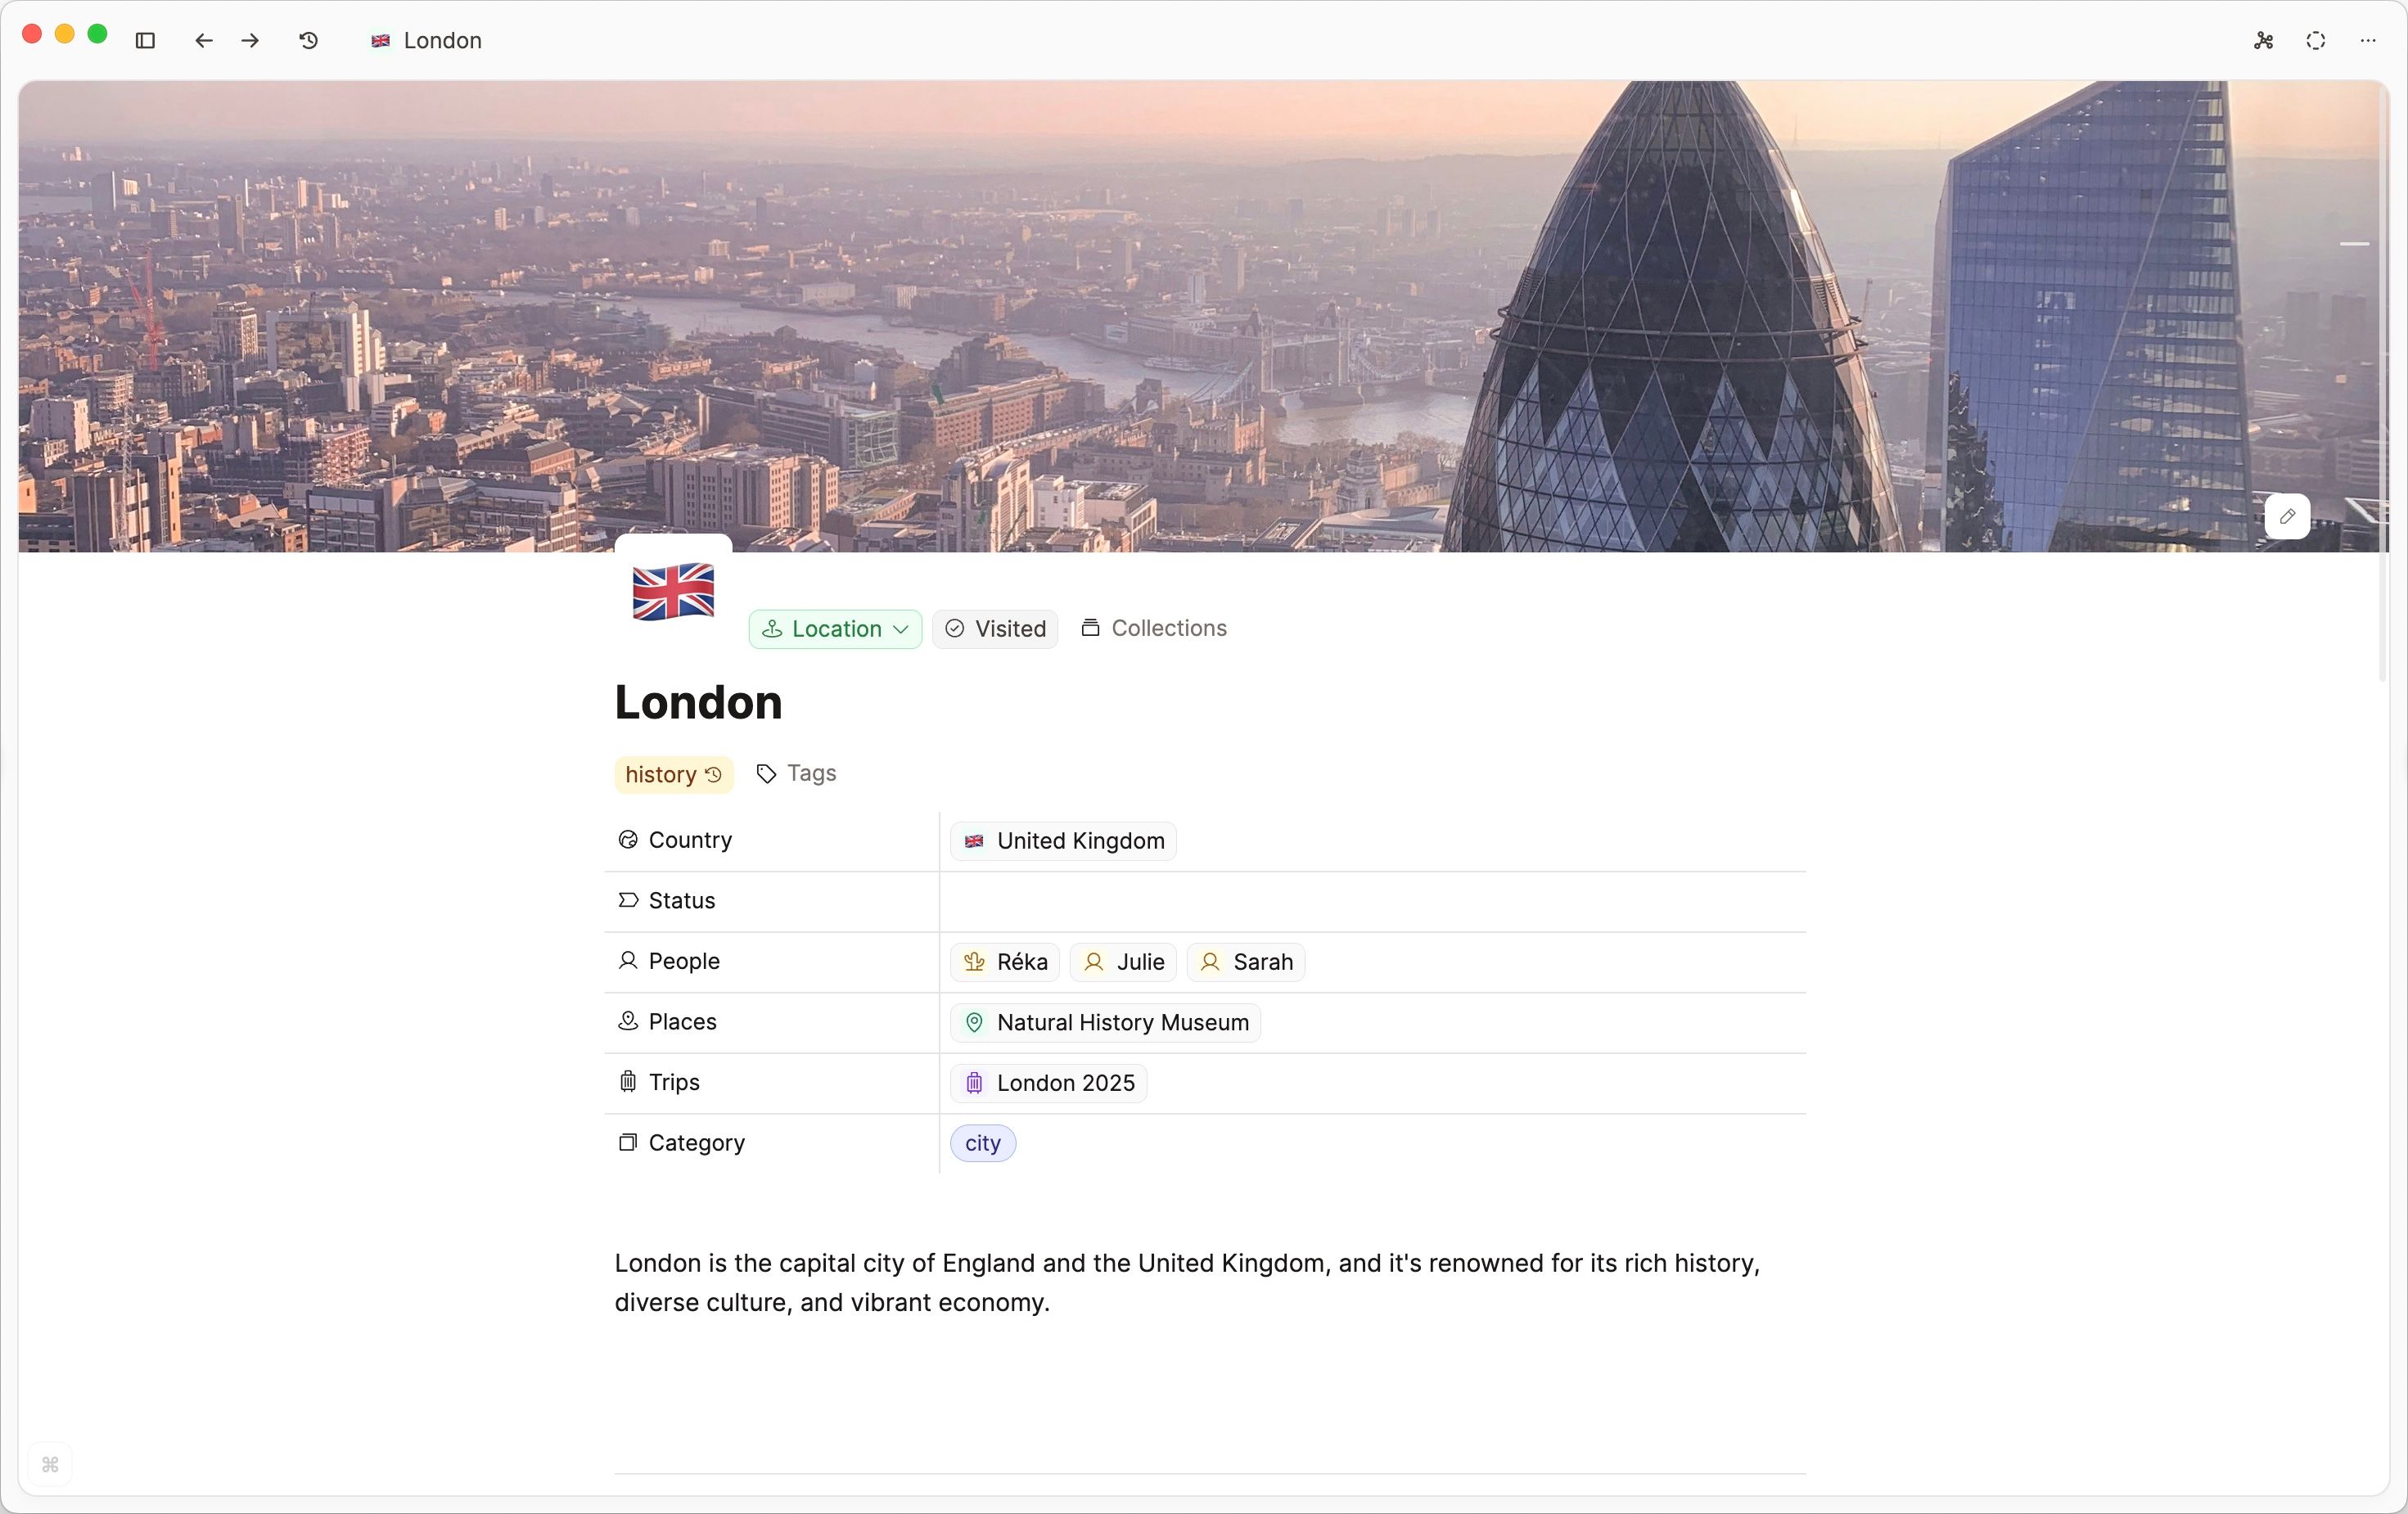
Page view
Choosing a default link view
You can set a default link view per object type (for example, link block instead of small card). Open the object type, go to Object type settings, and choose Default link view from the drop-down.
This only affects block links — links on their own line or paragraph. A link inside running text is always the inline view (underlined text). It cannot default to link block or a card view while it stays inline.
To use your default view (such as link block):
- Make sure the link is a block link, not inline in a sentence. Link at the start of a block (for example type
@on a new line), or convert an inline link to a block. - Set Default link view for that object type (for example Link block).
- If new links still appear inline, turn off
Settings > Editor > Always create inline links.
If you already see a small card, wide card, or link block, the link is already a block link — change Default link view in the object type settings for that type.
You can still change any link’s view afterward from the block menu (... → Change view).
If you prefer inline links when linking while typing, go to Settings > Editor > Always create inline links.
Data views
Data views are the views for a group of objects.
These views occur on many occasions, for example when displaying the content of an object type, query, a collection, or a tag.
The small card object view is used for wall and gallery views.
Table view
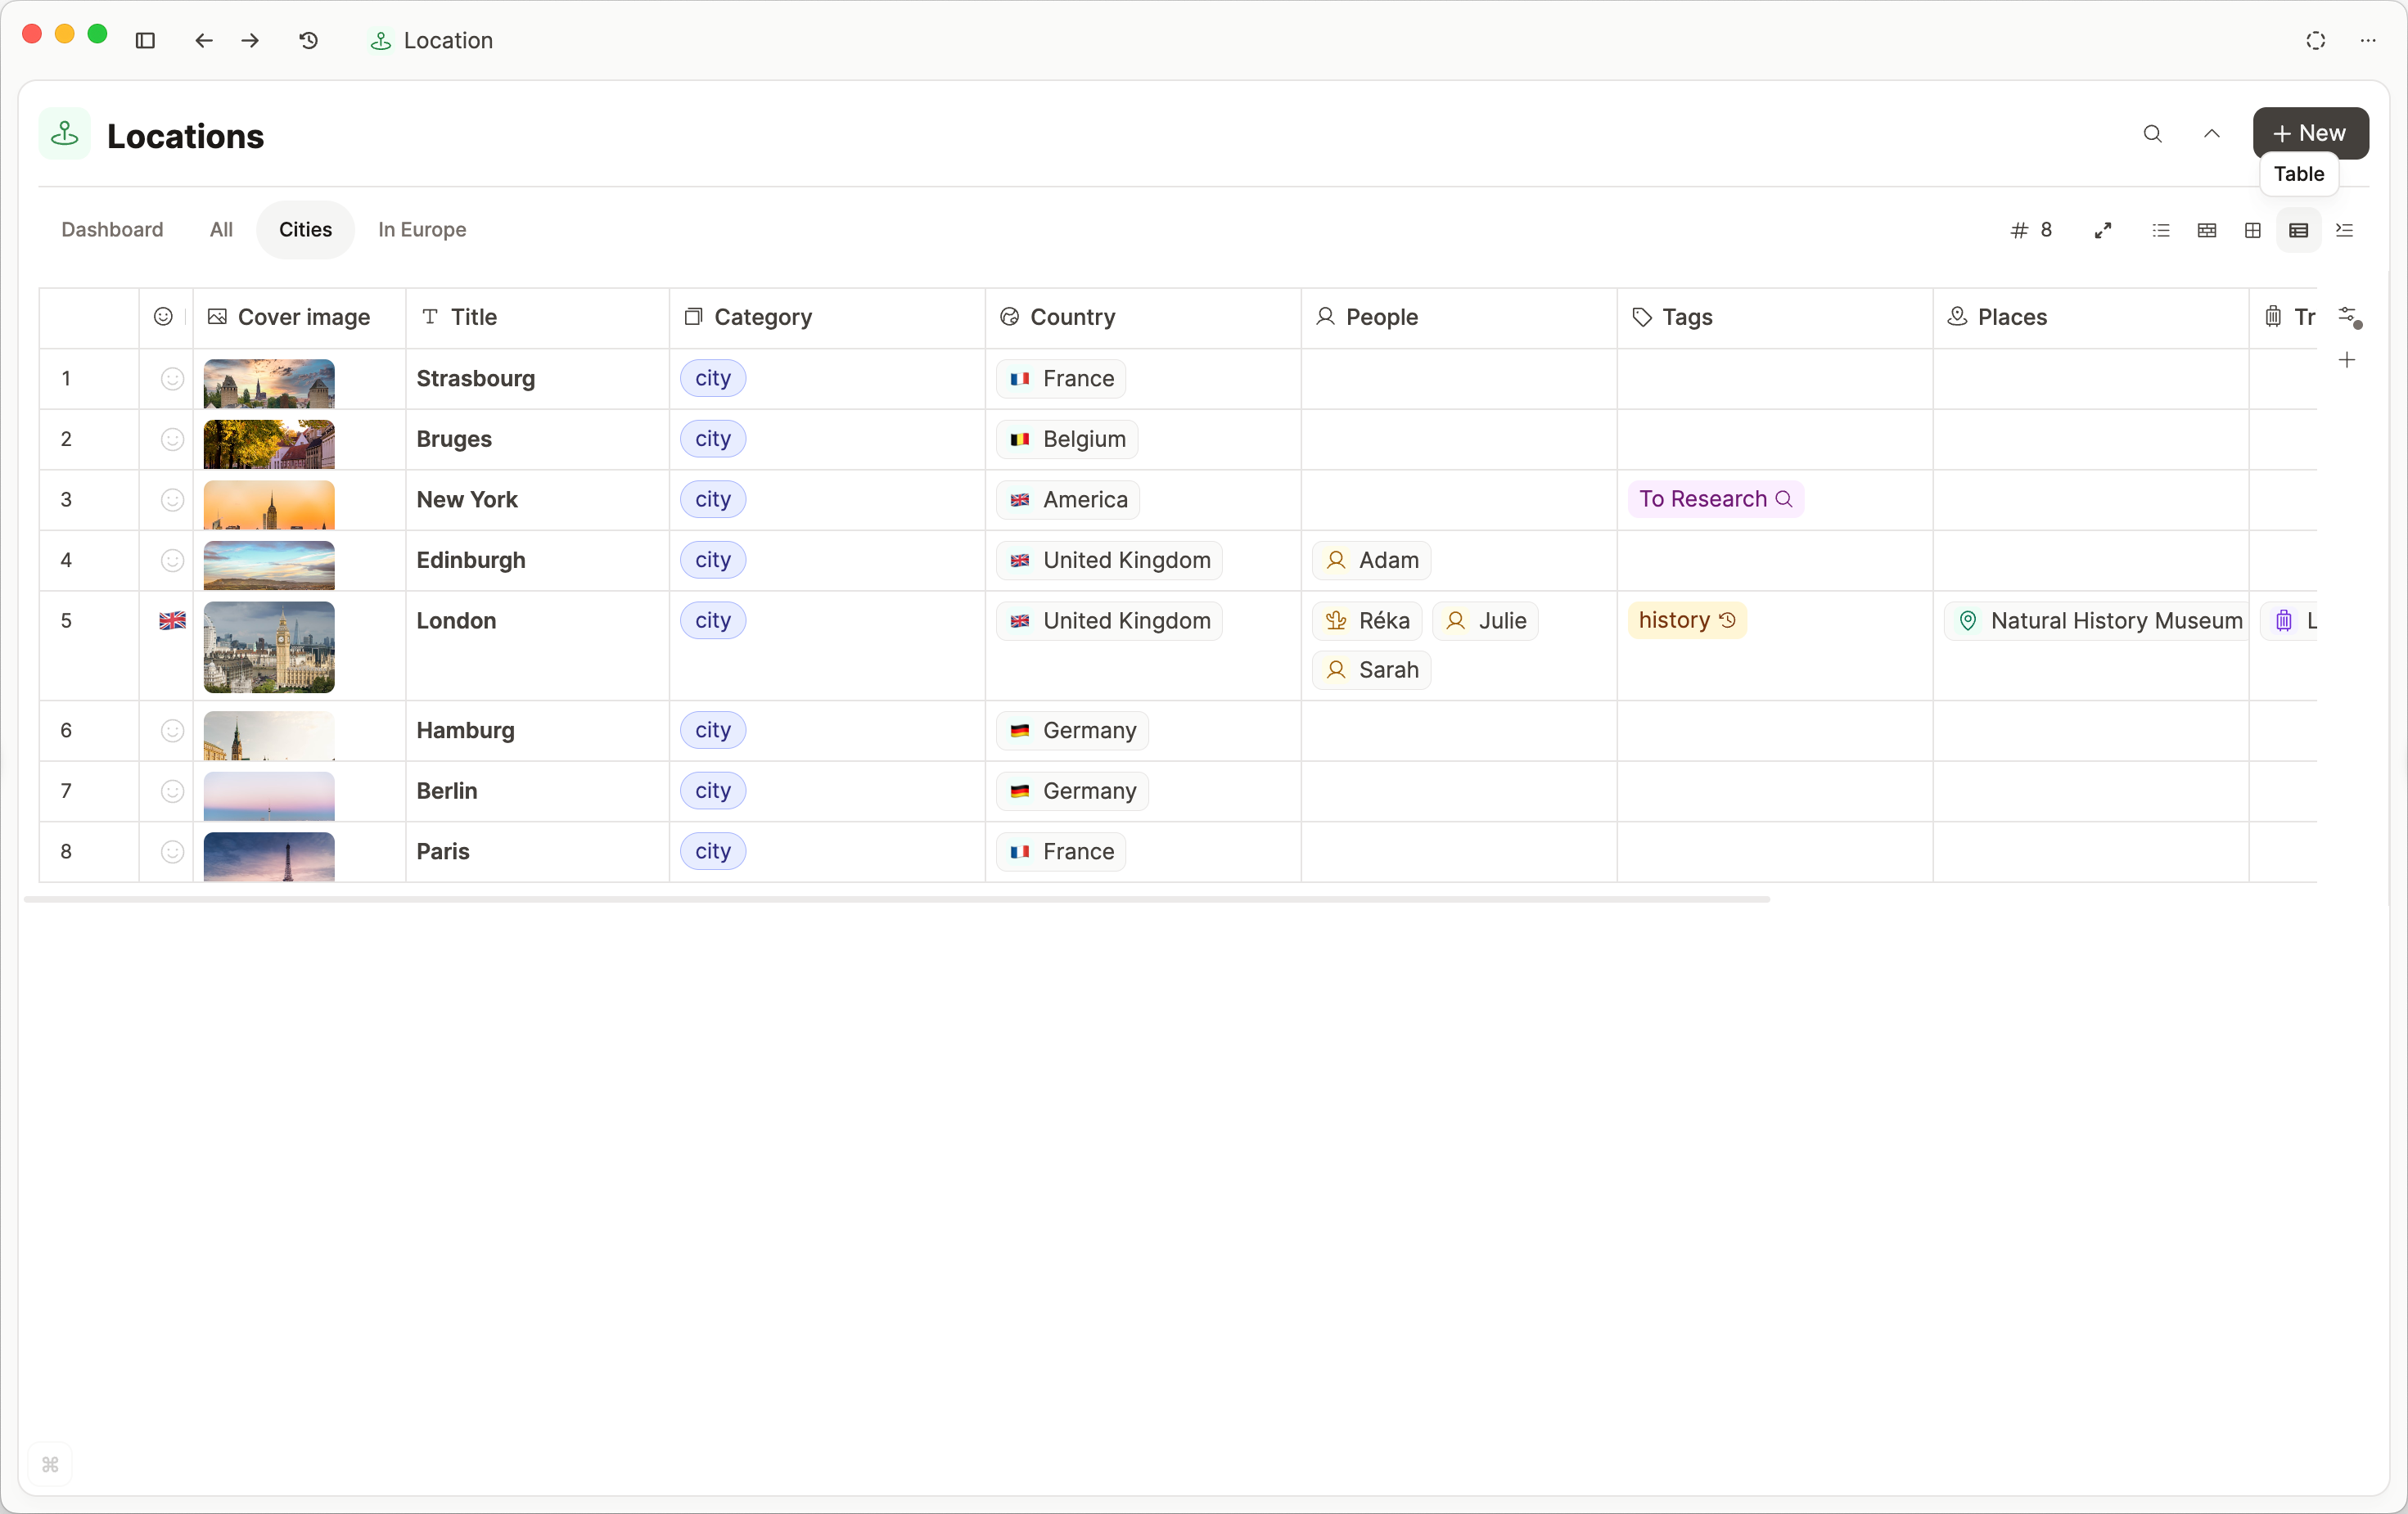
Table View is the most detailed of our data views. It shows you a bird's eye view of your objects, showing all the properties. It's great for reviewing your content.
You can customize your table view to get the exact configuration you need. Read about this here.
Gallery view
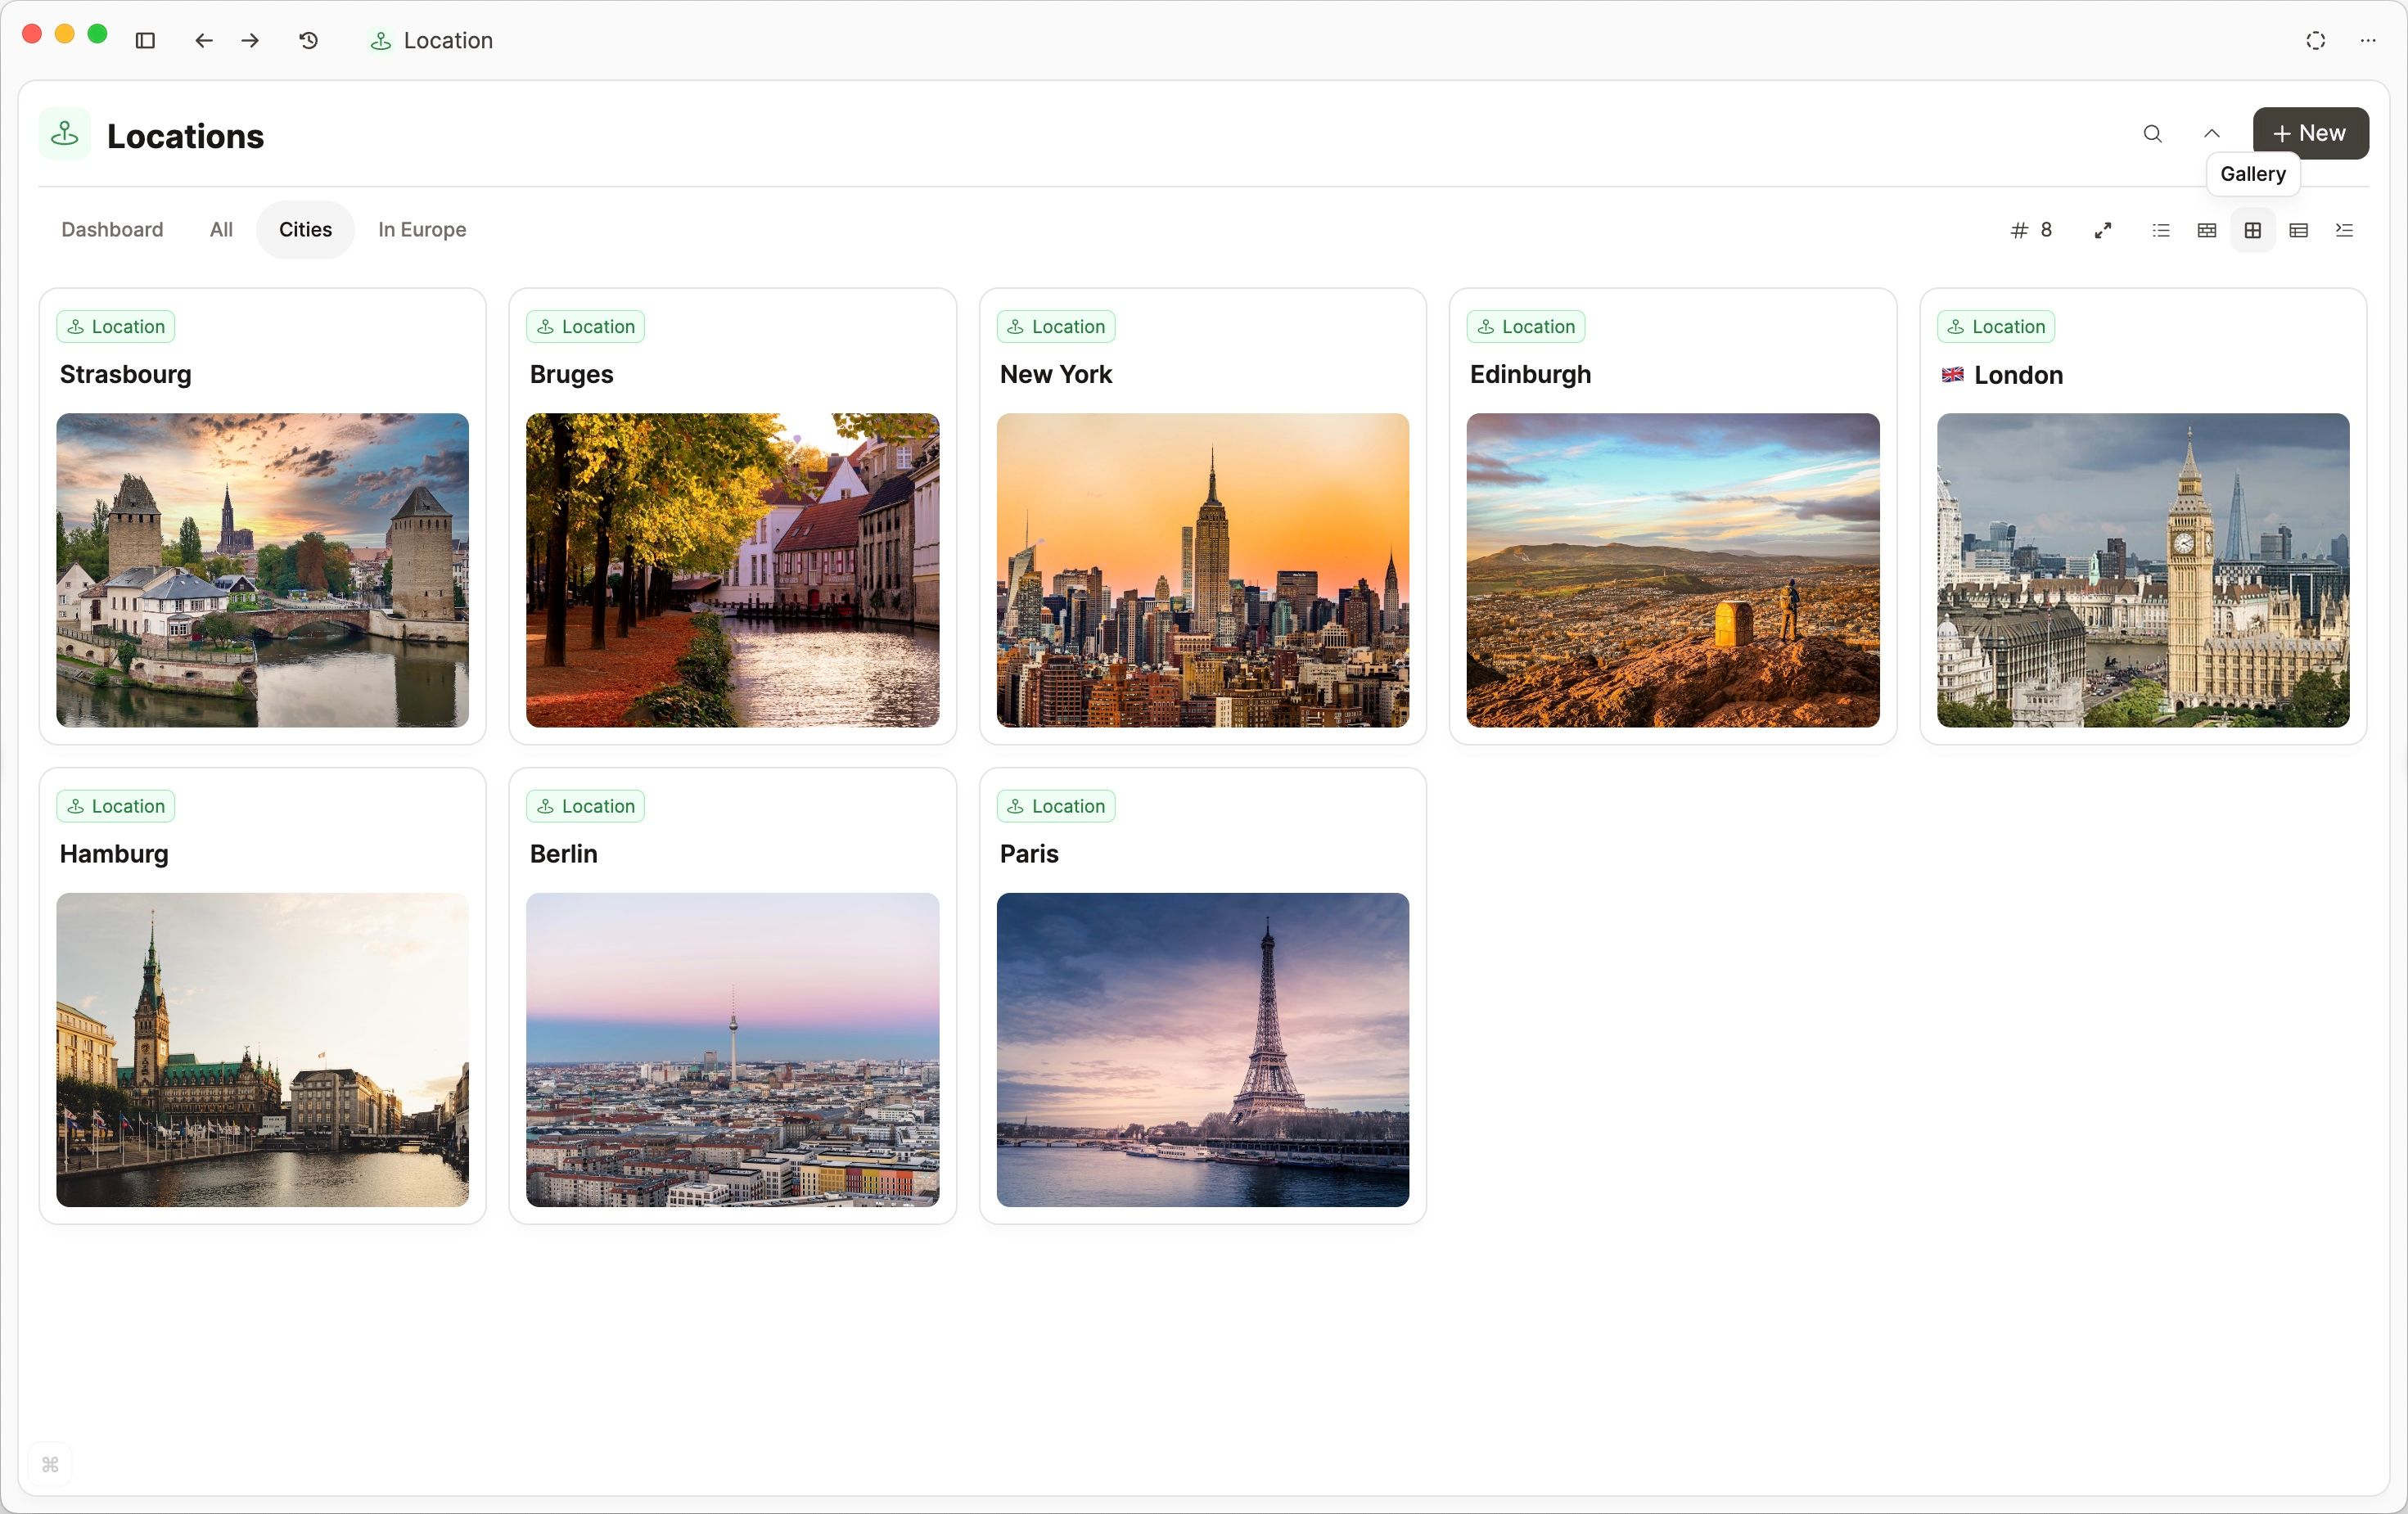
Customize this following the small card customization docs.
Wall view
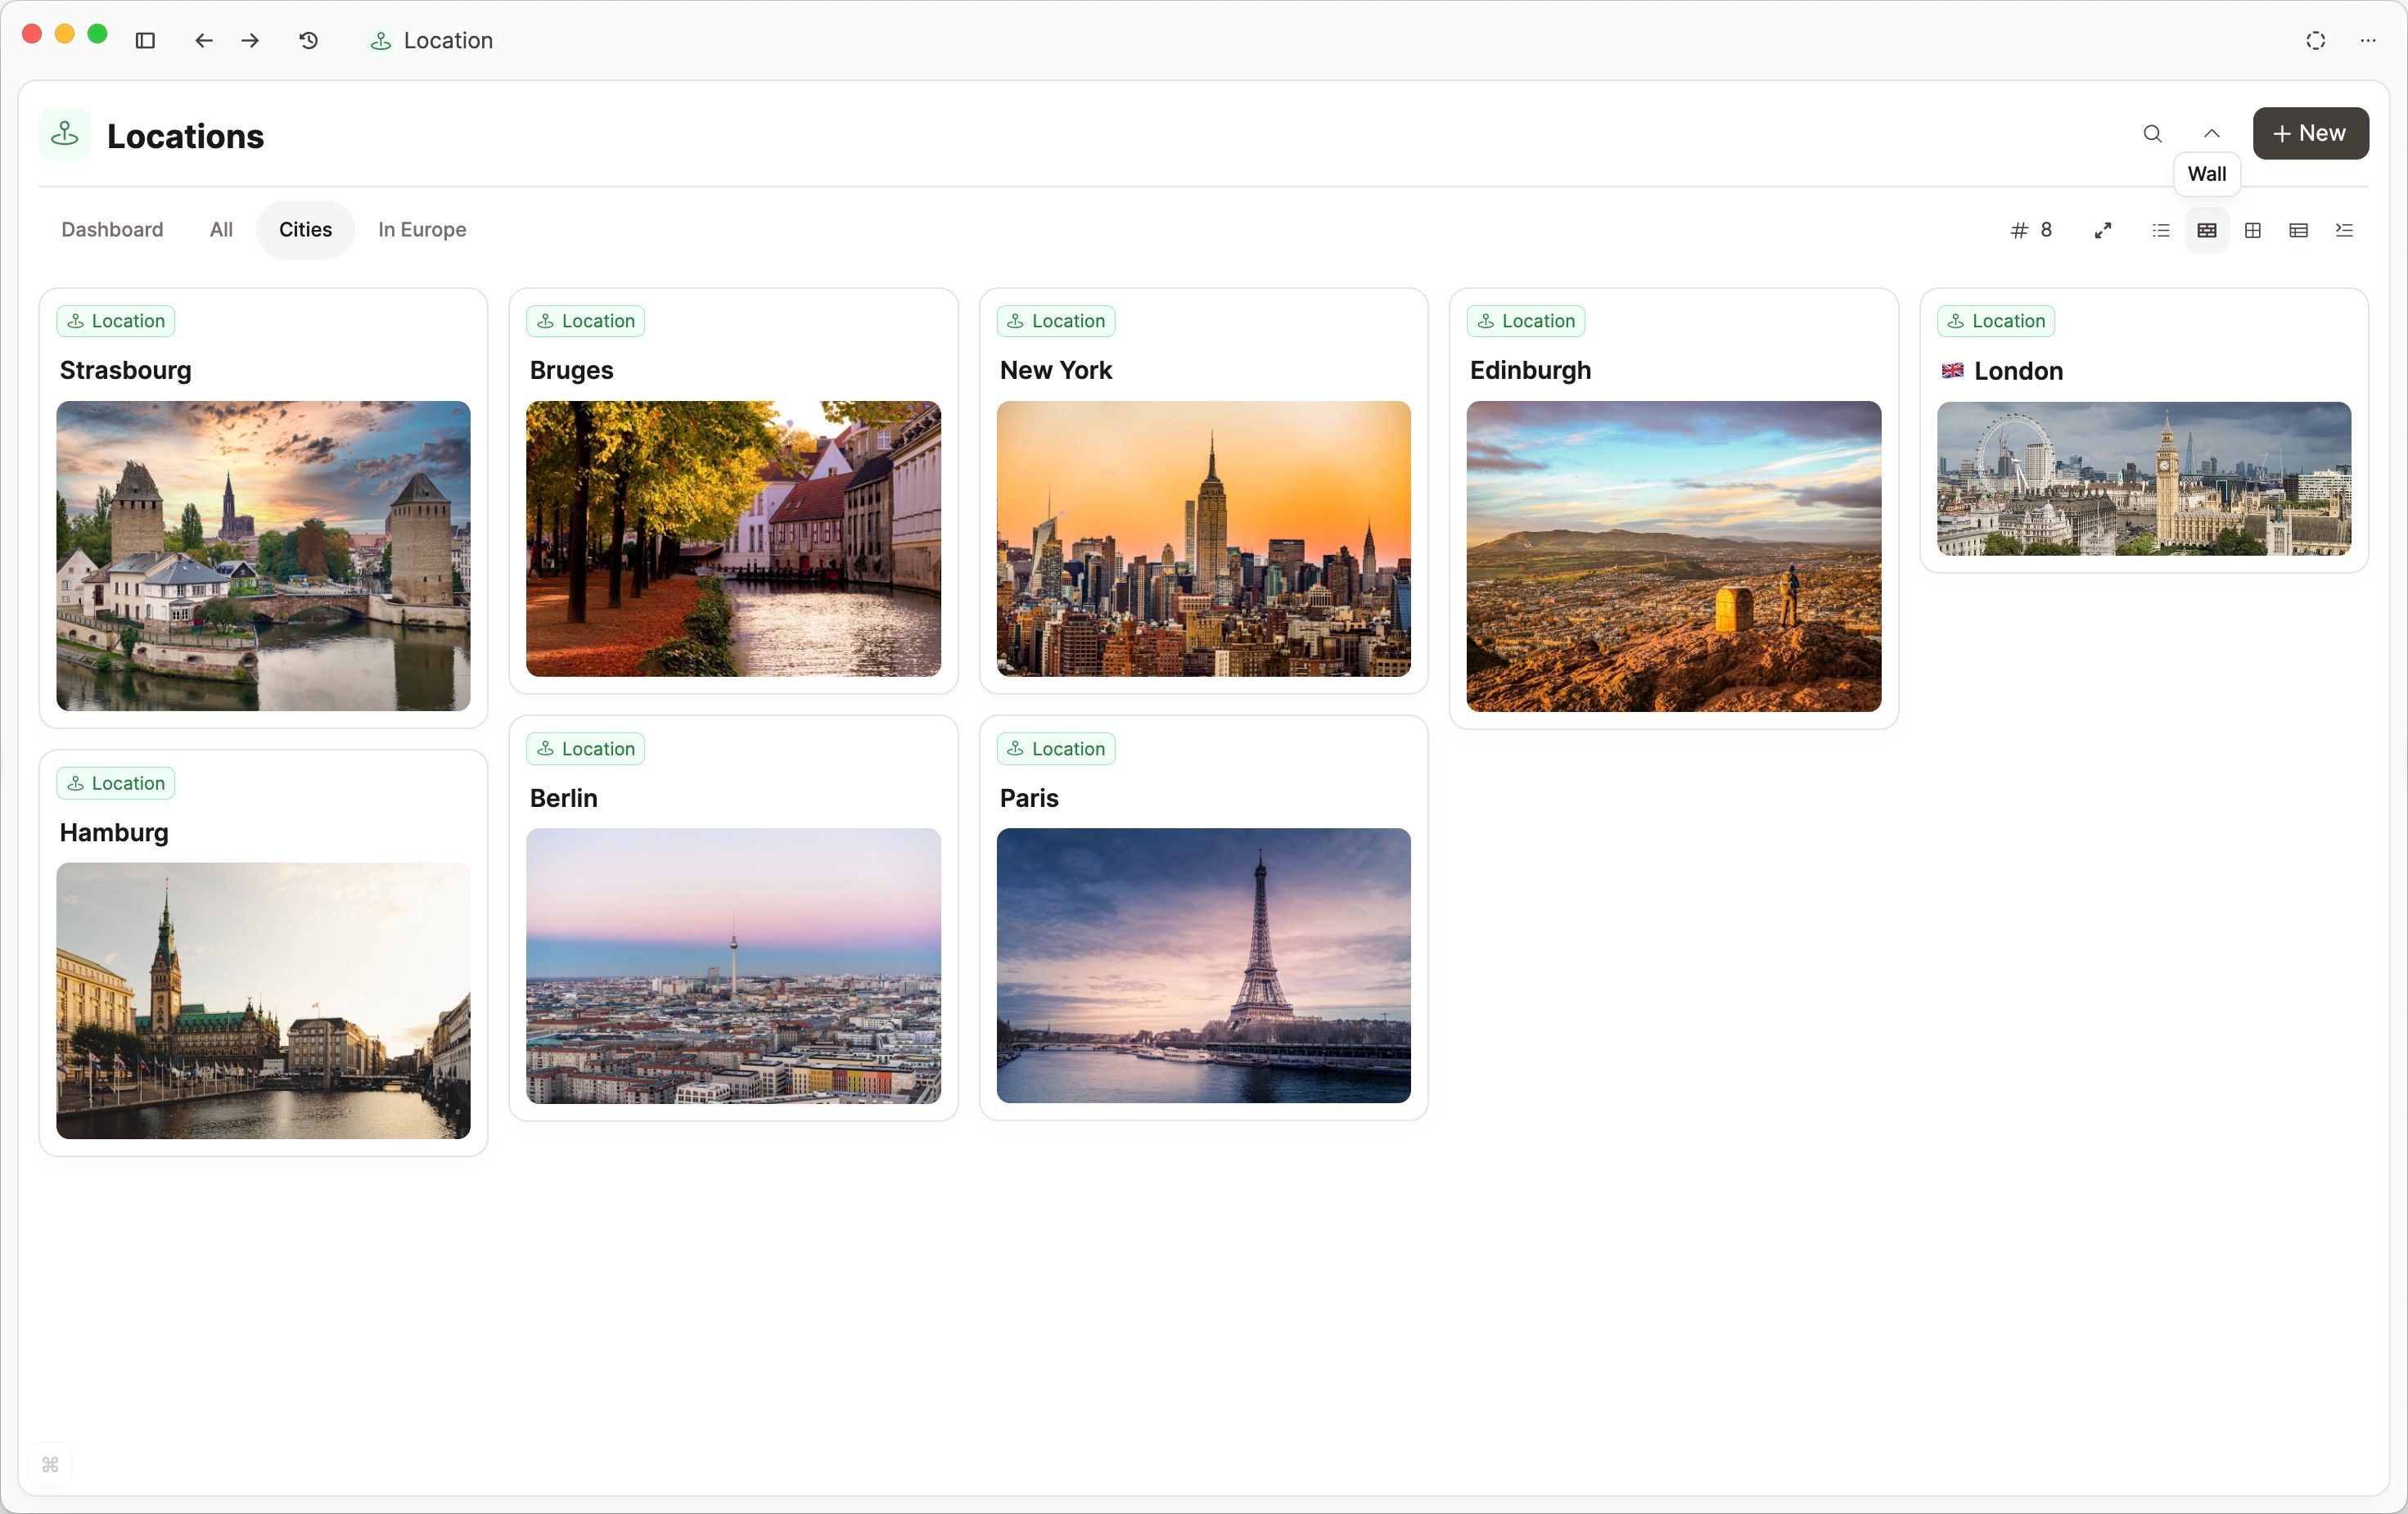
Customize this following the small card customization docs.
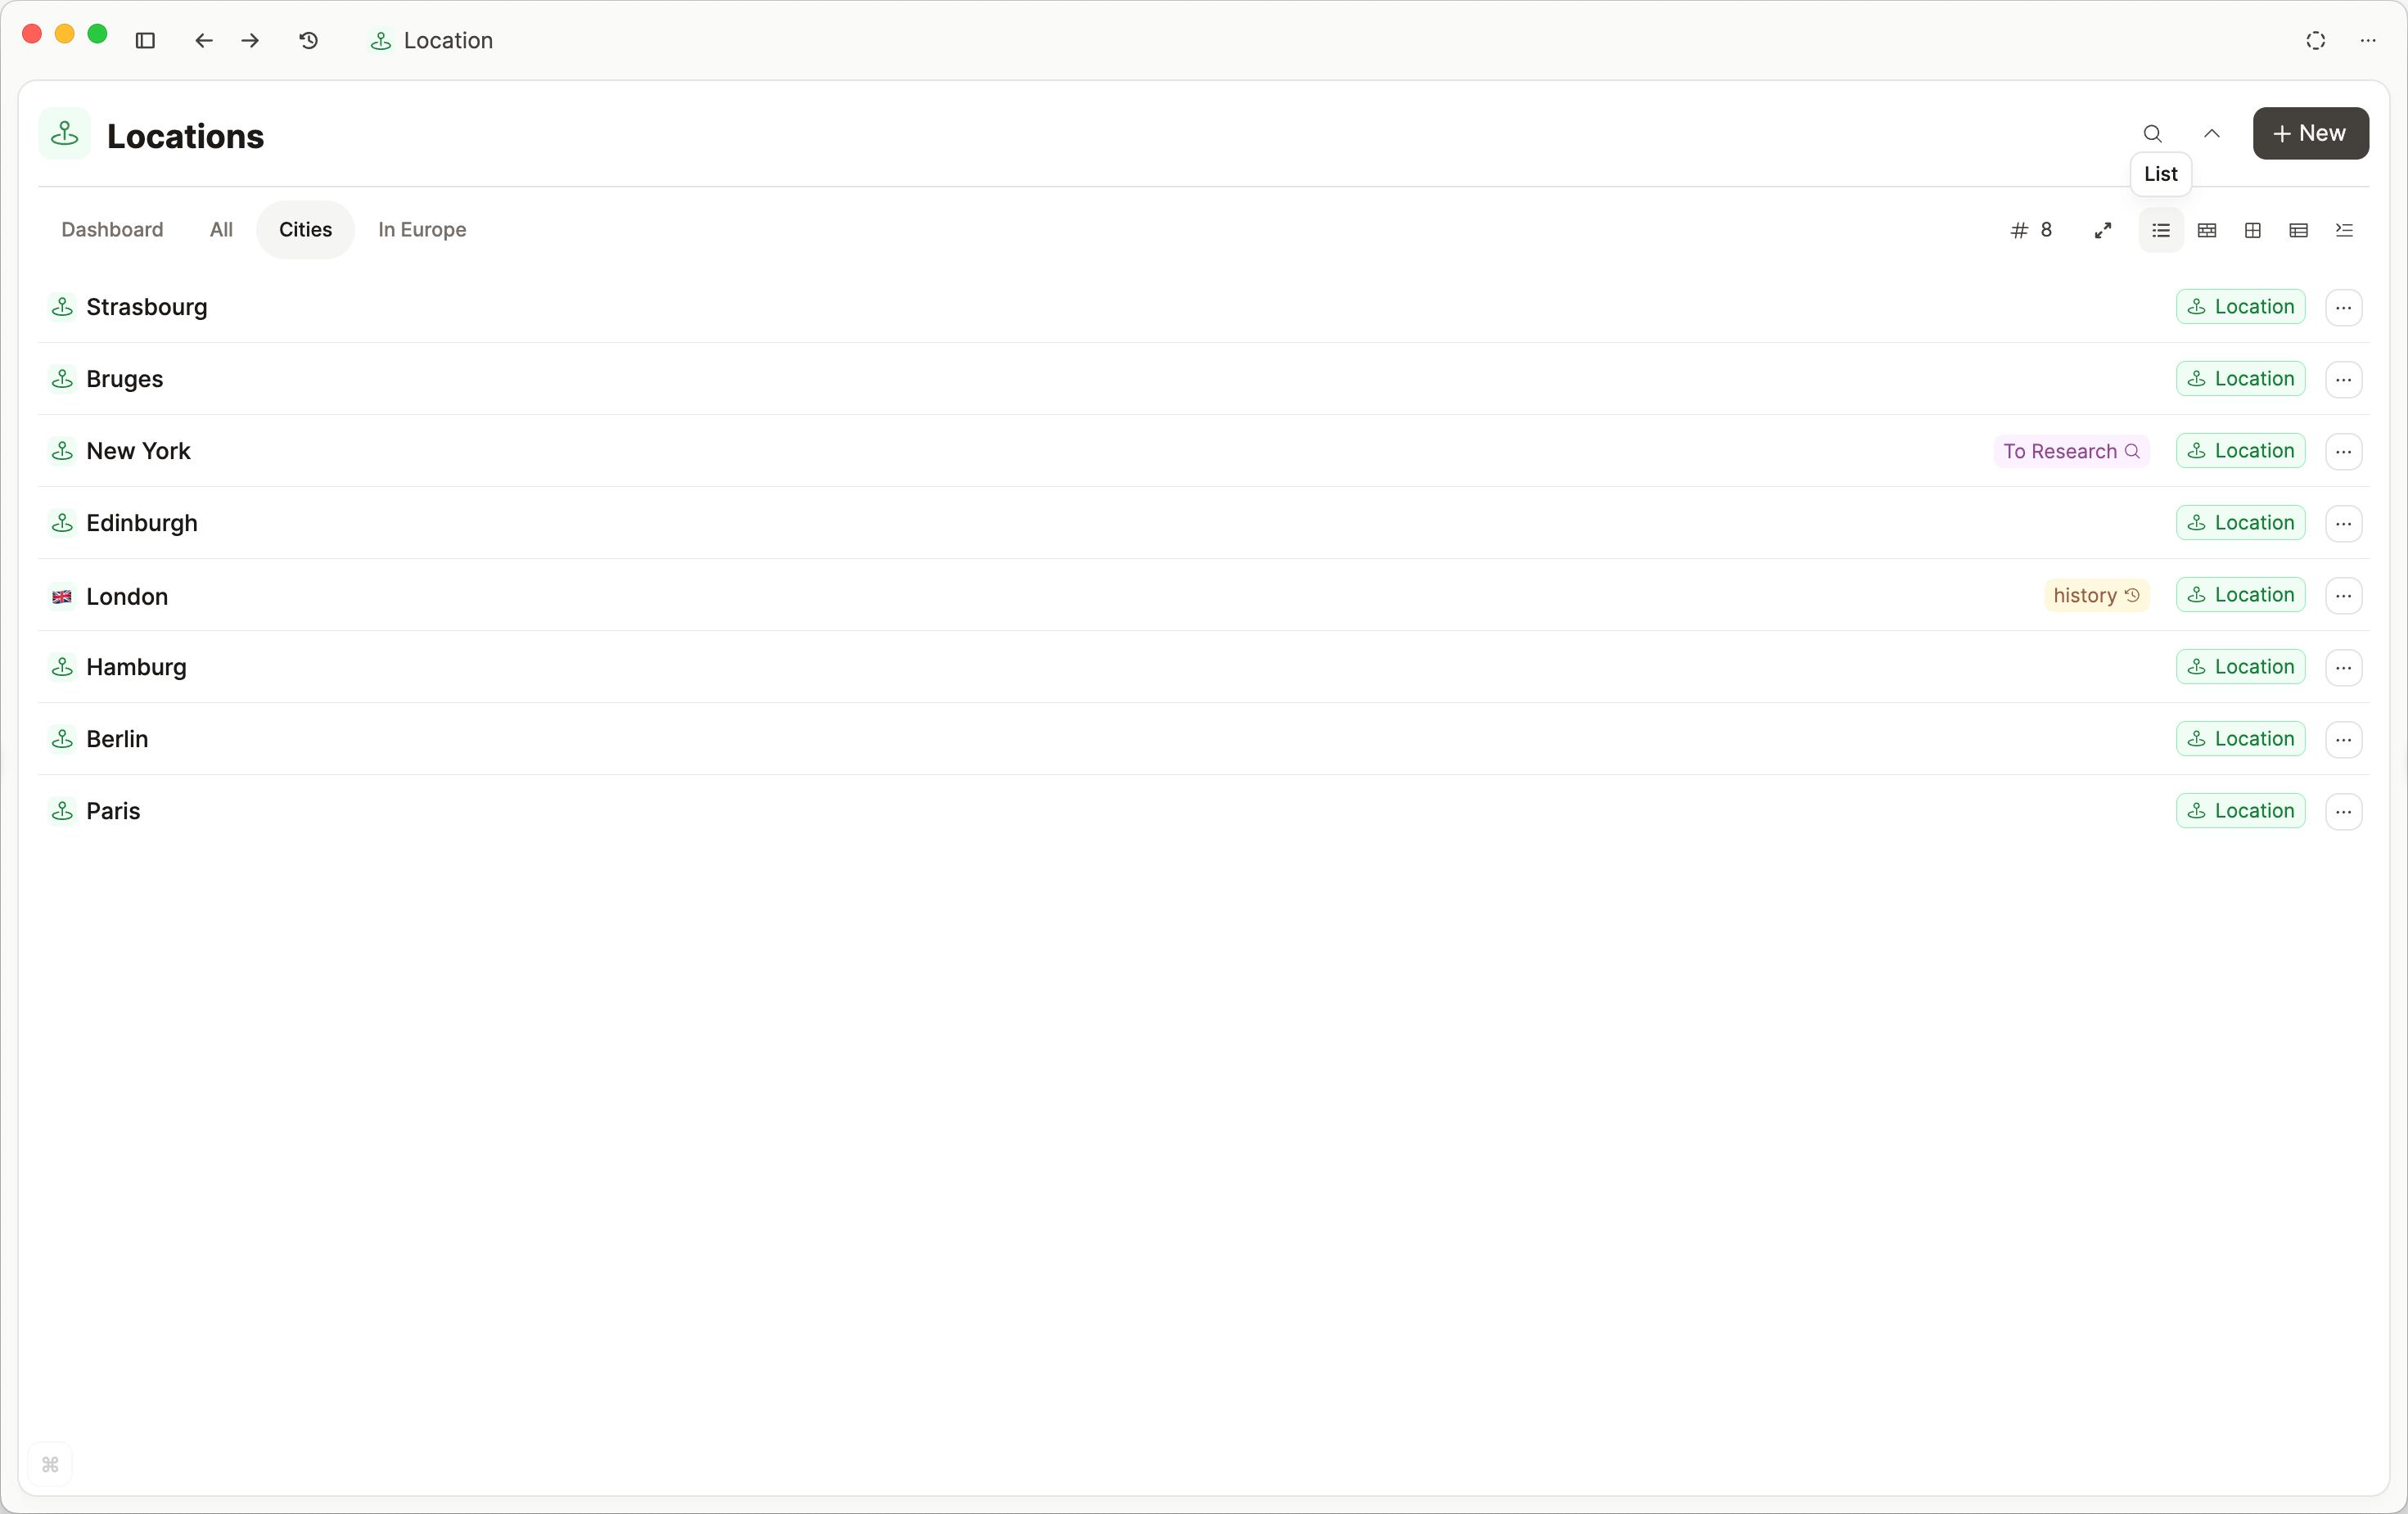
List view
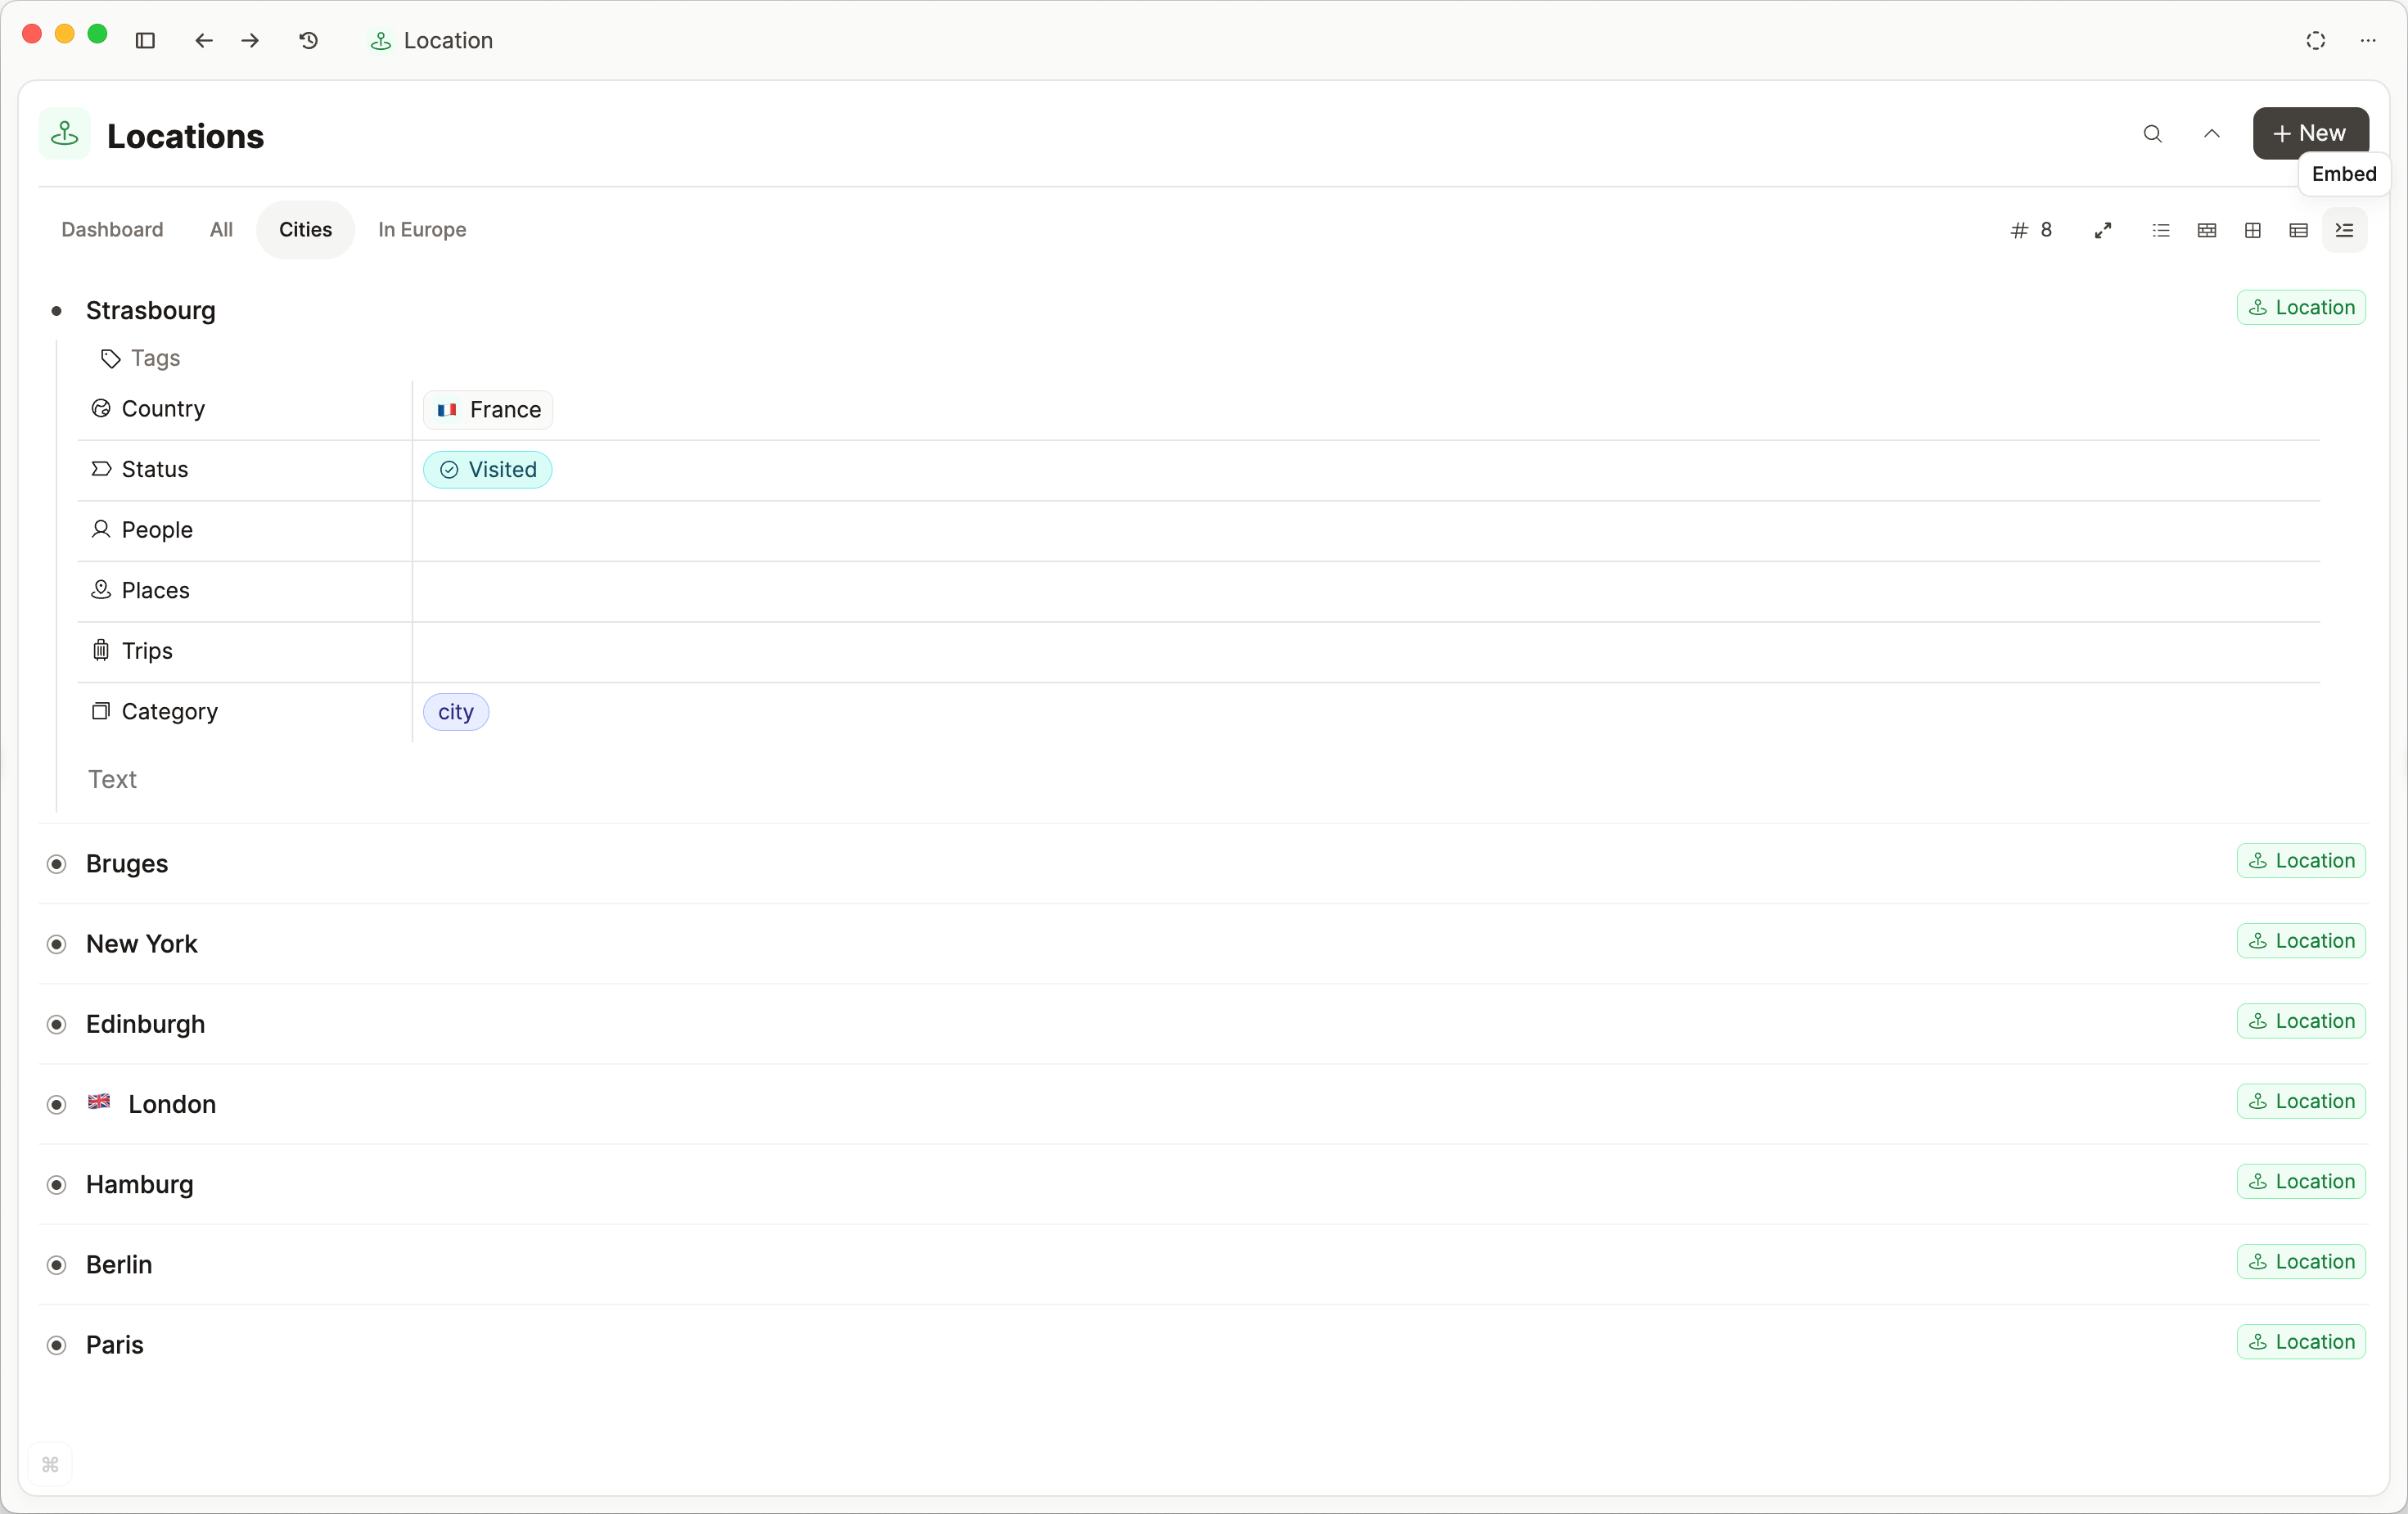
Embed view
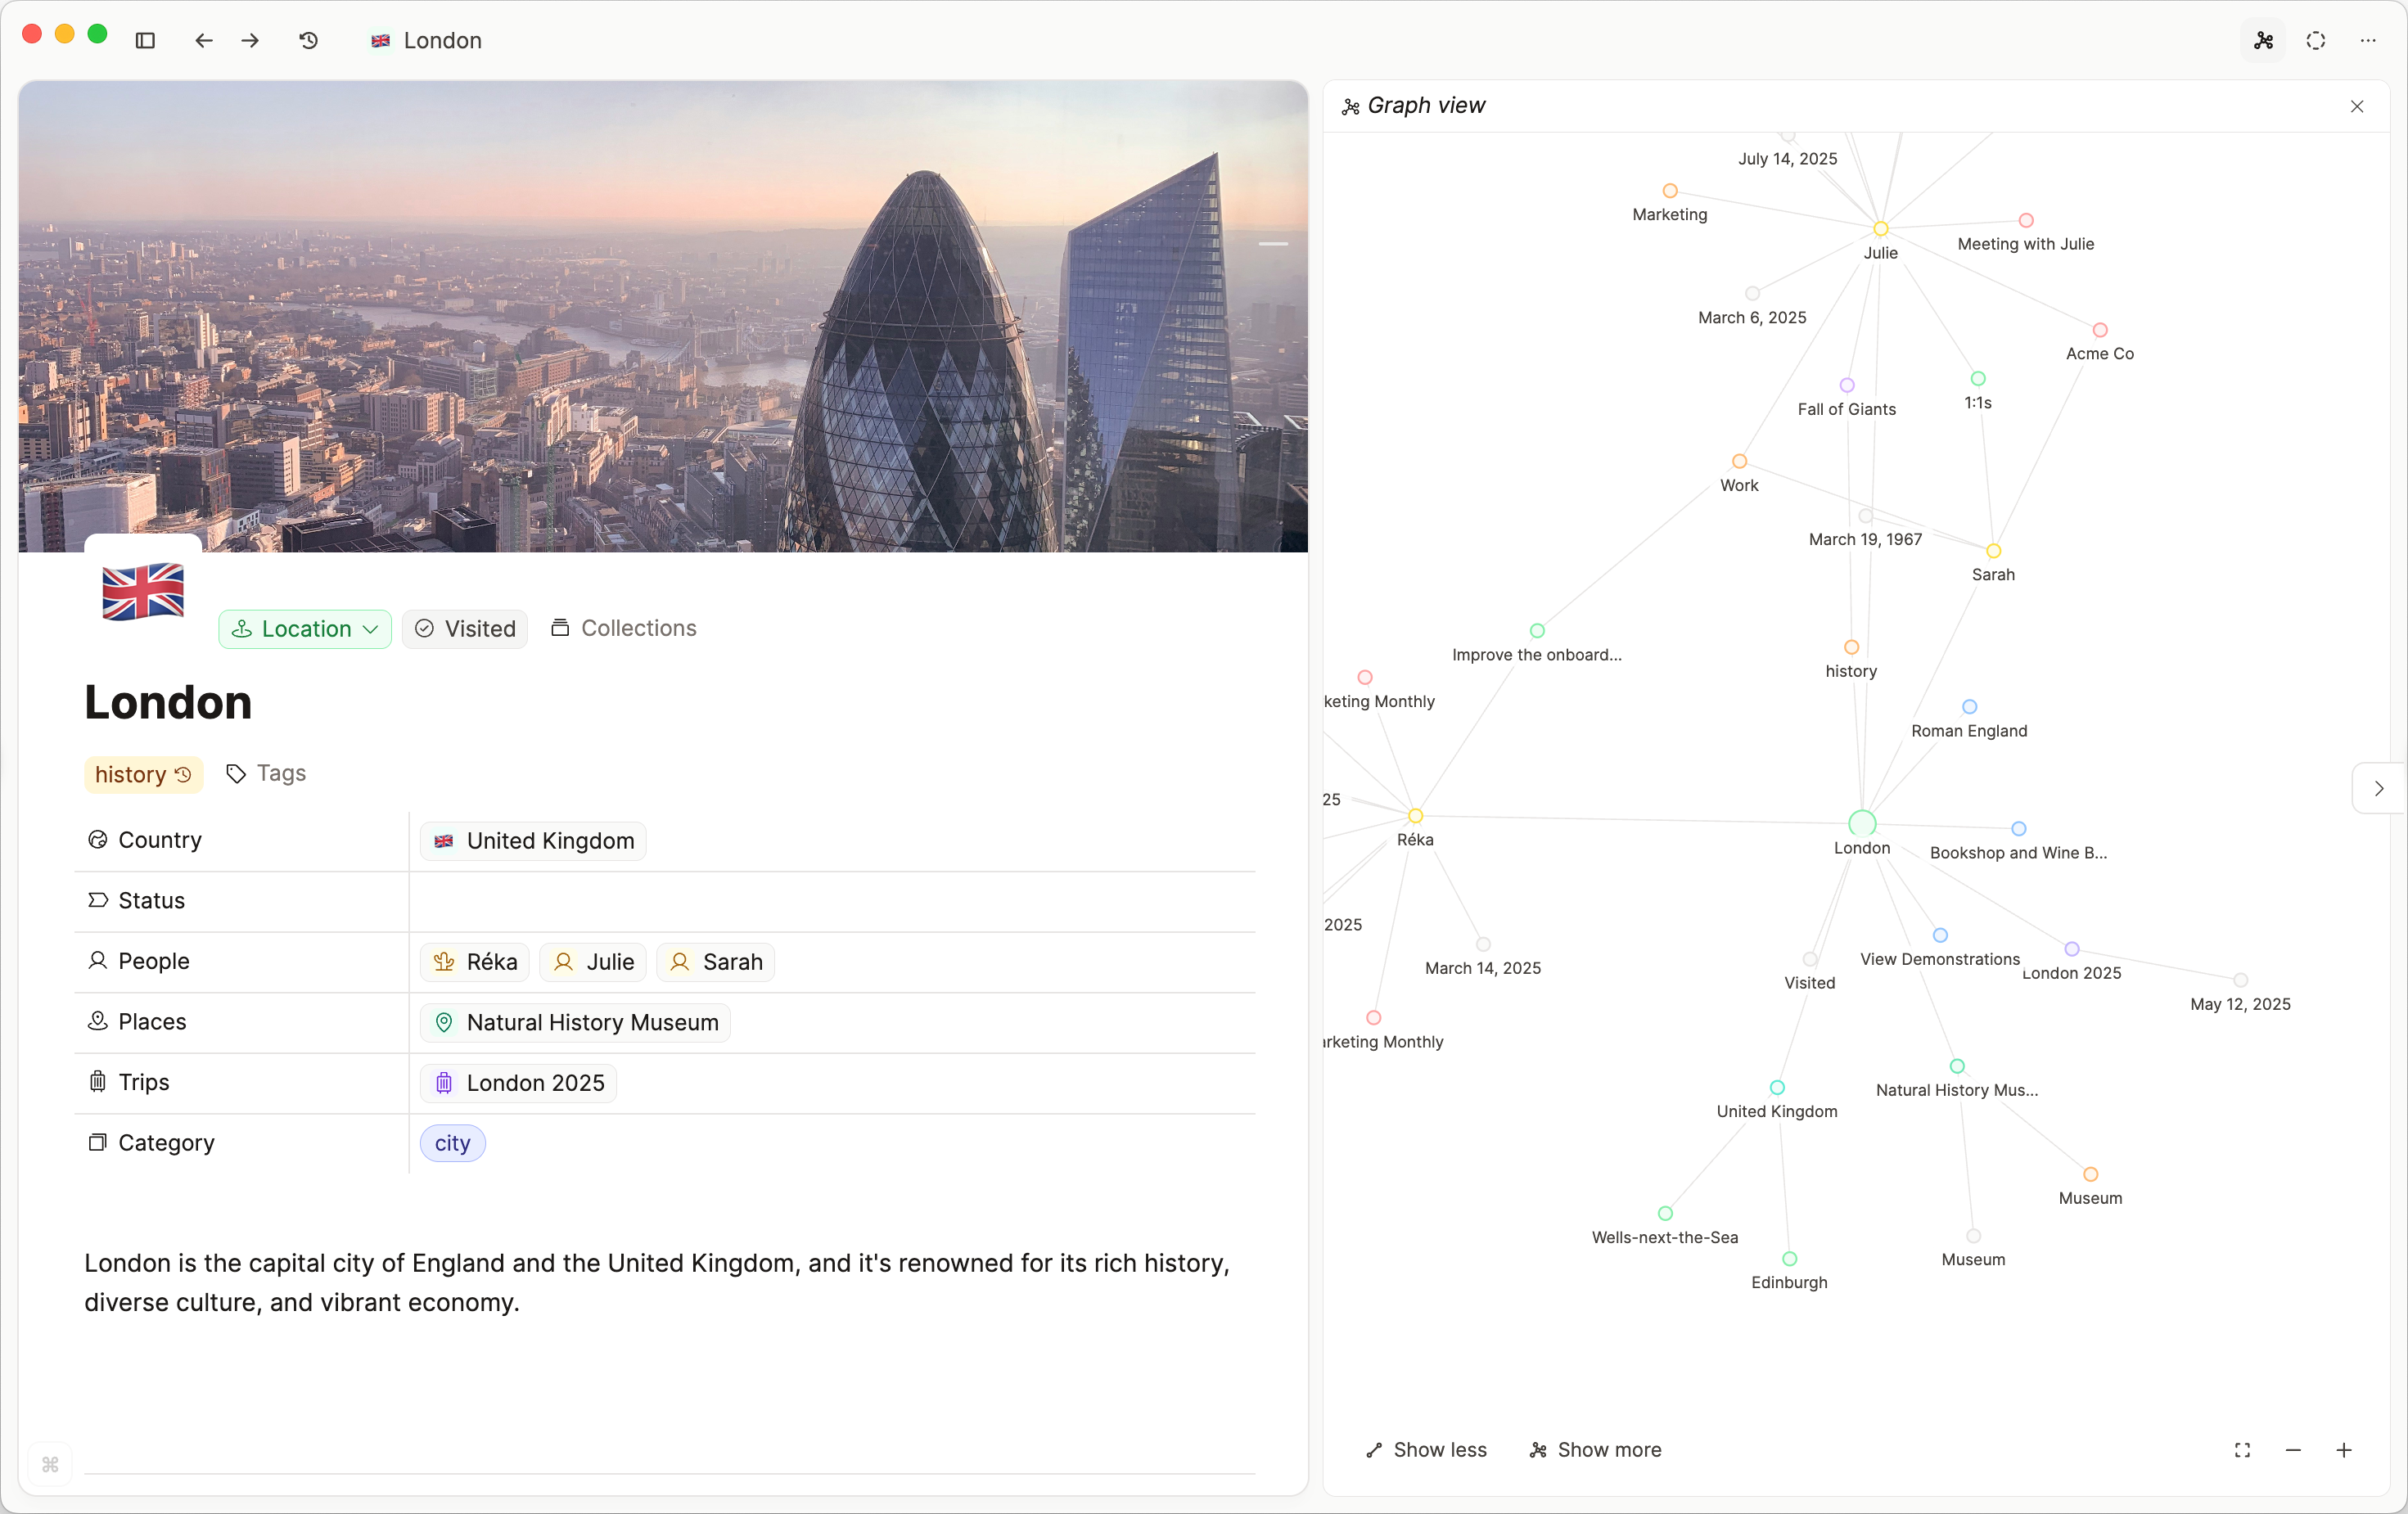
Graph view
The graph view is a special view that allows you to explore the local context of an object by visualizing all ingoing and outgoing connections. To see the graph view, open an object and look for the graph icon in the top right.
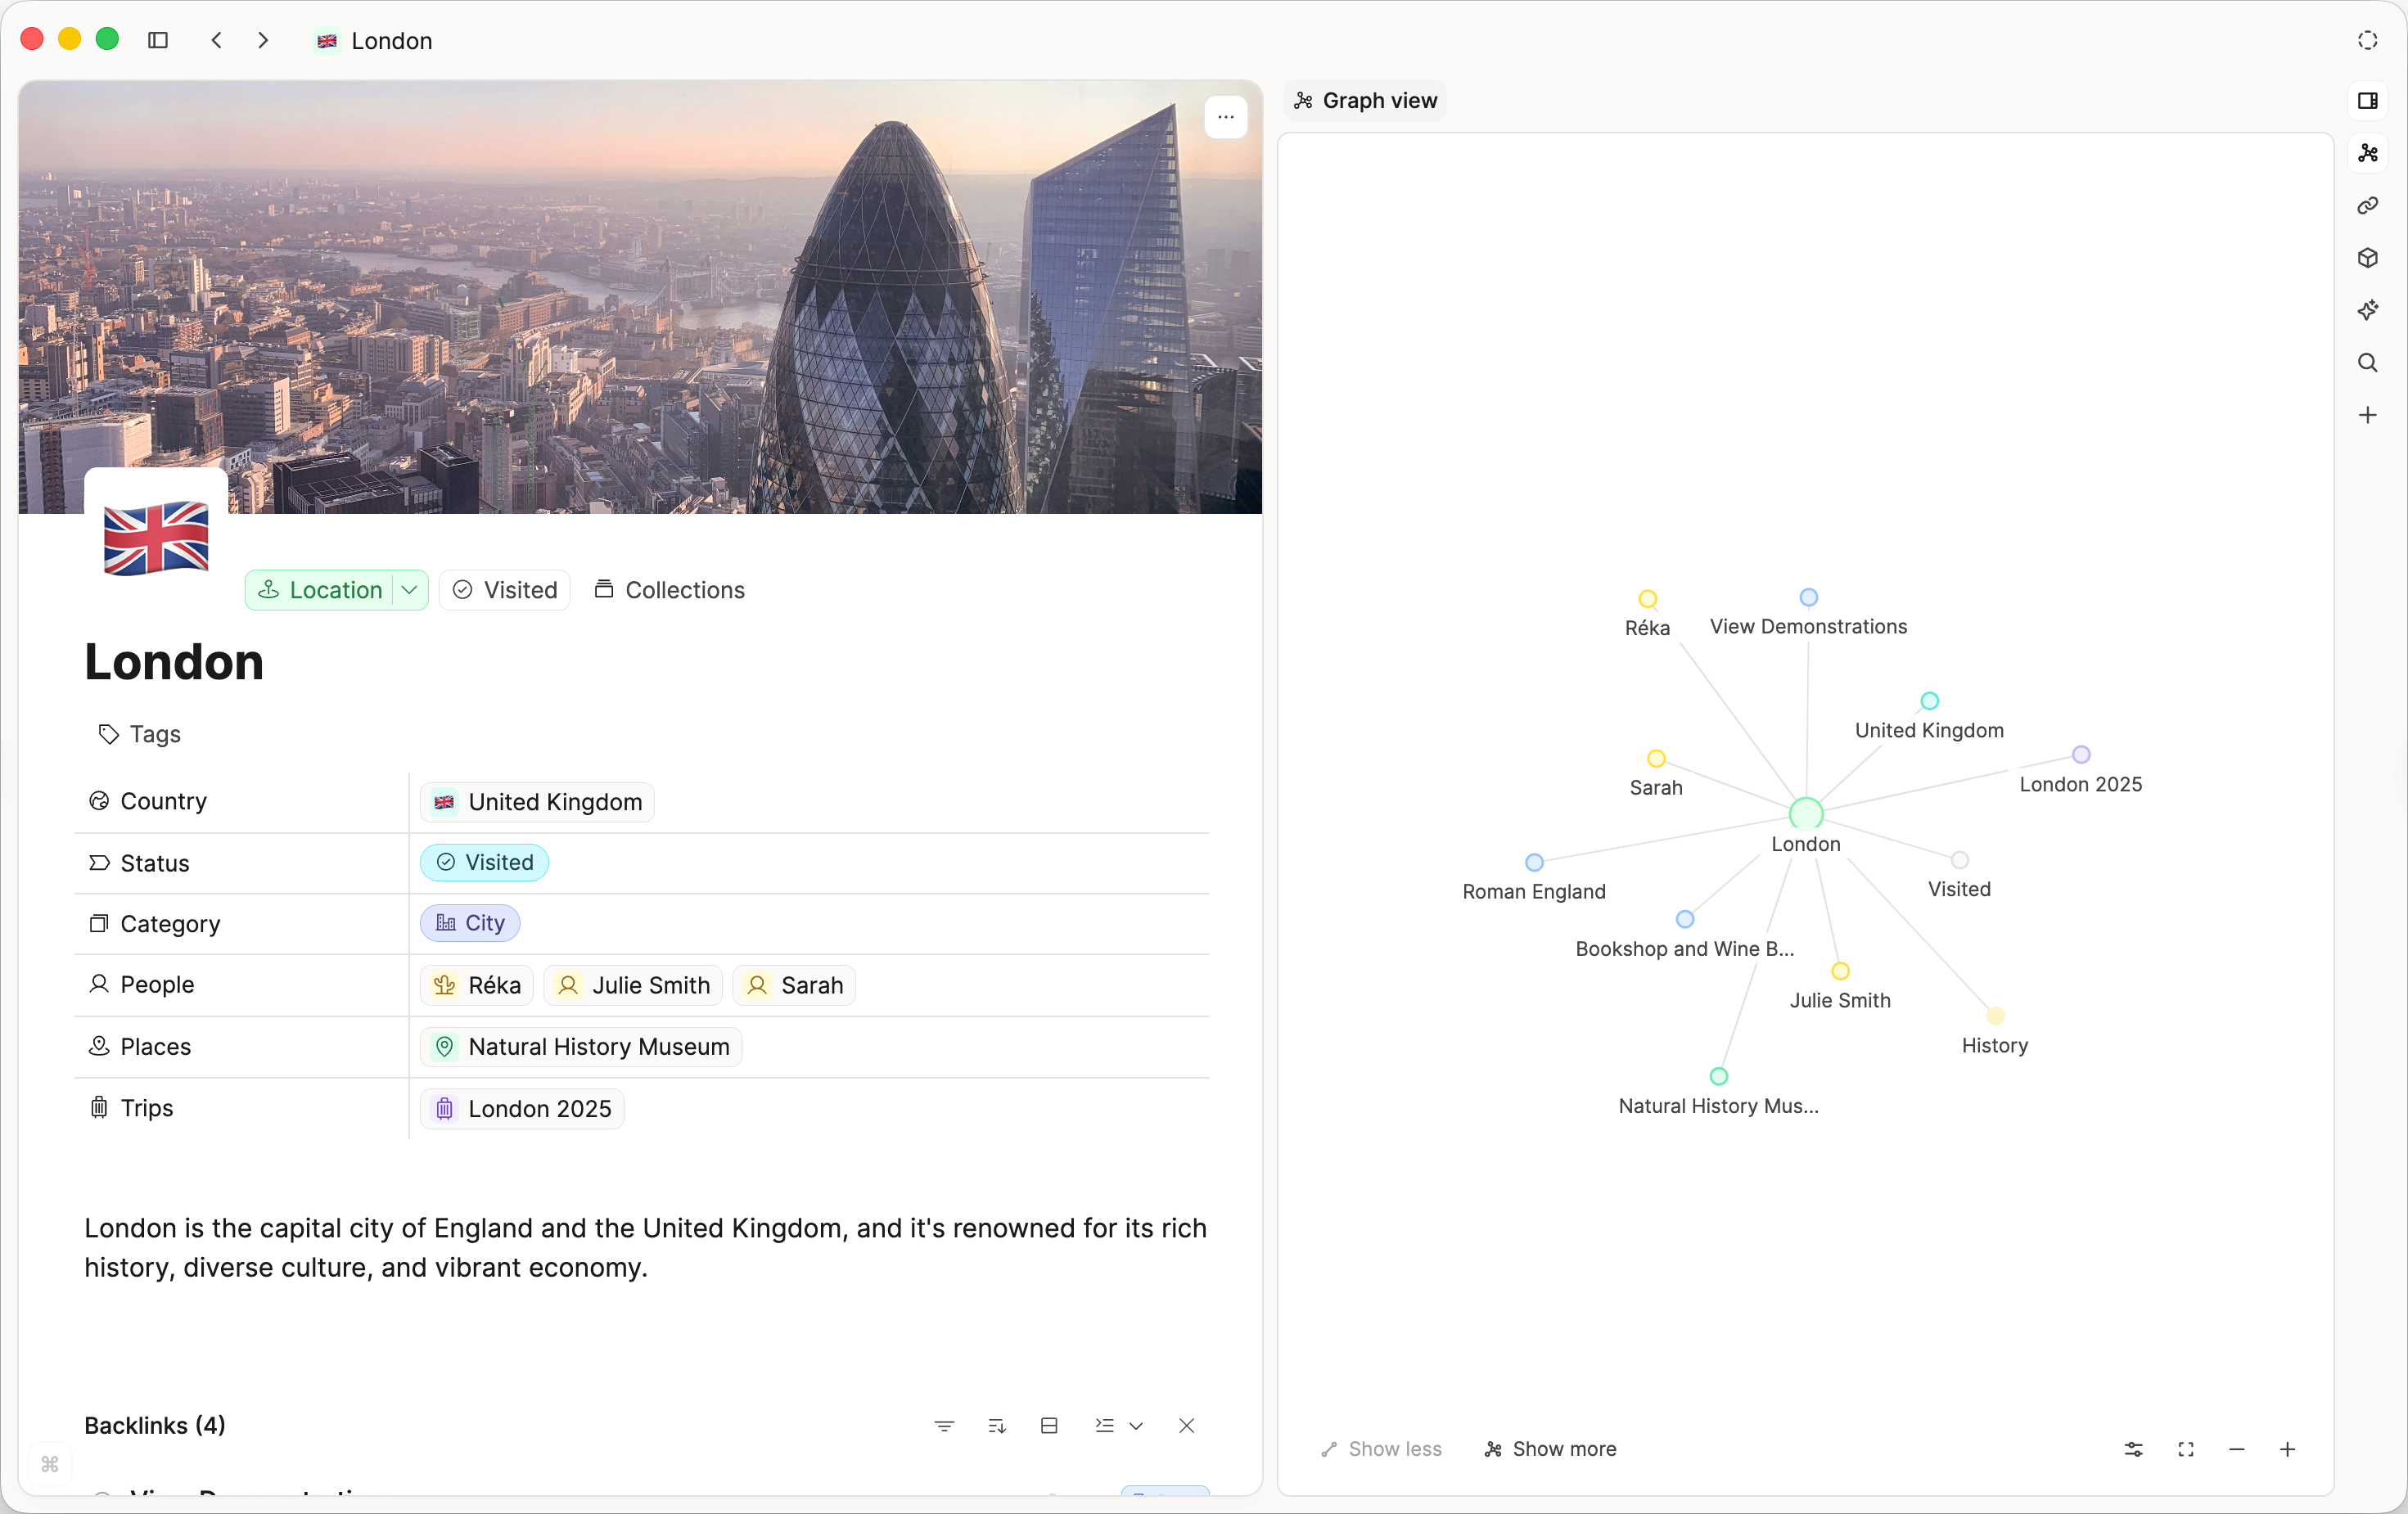
You can click 'Show more' to see more connections.
Capacities has no global graph view. You can request a full graph view by voting on this ticket
FAQs
- Can I link in text but have link block (or another view) by default?
Not while the link stays inline in a sentence — inline links are always underlined text. To default to link block (or small card, wide card, embed, and so on), the link must be a block link, and you set Default link view in that object type’s settings. See Choosing a default link view. If you already see cards or a link block, you only need to update the default in object type settings. - How can I change my inline link to another view?
If your link is underlined, click on it whilst holding down the Option key (Mac) or the Alt key (Windows). Click Turn into block. Then you will see the three-dot menu (...) on the right-hand side of the block. Click that, then go to Change view.
To make that view the default for future block links to that type, set Default link view in the object type settings.
Ask a question! - The Docs Assistant knows everything about the documentation, and the ideas and feature requests from other users.
Create a ticket on our feedback board. - Let us know if you have an idea for a feature, improvement or think there is something missing.
Request additions to the documentation. - If your questions are not getting answered, let us know and we will extend the documentation.